In this two-part post, we will explore the set of observability tools which are part of the Istio Service Mesh. These tools include Jaeger, Kiali, Prometheus, and Grafana. To assist in our exploration, we will deploy a Go-based, microservices reference platform to Google Kubernetes Engine, on the Google Cloud Platform.
What is Observability?
Similar to blockchain, serverless, AI and ML, chatbots, cybersecurity, and service meshes, Observability is a hot buzz word in the IT industry right now. According to Wikipedia, observability is a measure of how well internal states of a system can be inferred from knowledge of its external outputs. Logs, metrics, and traces are often known as the three pillars of observability. These are the external outputs of the system, which we may observe.
The O’Reilly book, Distributed Systems Observability, by Cindy Sridharan, does an excellent job of detailing ‘The Three Pillars of Observability’, in Chapter 4. I recommend reading this free online excerpt, before continuing. A second great resource for information on observability is honeycomb.io, a developer of observability tools for production systems, led by well-known industry thought-leader, Charity Majors. The honeycomb.io site includes articles, blog posts, whitepapers, and podcasts on observability.
As modern distributed systems grow ever more complex, the ability to observe those systems demands equally modern tooling that was designed with this level of complexity in mind. Traditional logging and monitoring systems often struggle with today’s hybrid and multi-cloud, polyglot language-based, event-driven, container-based and serverless, infinitely-scalable, ephemeral-compute platforms.
Tools like Istio Service Mesh attempt to solve the observability challenge by offering native integrations with several best-of-breed, open-source telemetry tools. Istio’s integrations include Jaeger for distributed tracing, Kiali for Istio service mesh-based microservice visualization, and Prometheus and Grafana for metric collection, monitoring, and alerting. Combined with cloud platform-native monitoring and logging services, such as Stackdriver for Google Kubernetes Engine (GKE) on Google Cloud Platform (GCP), we have a complete observability platform for modern, distributed applications.
A Reference Microservices Platform
To demonstrate the observability tools integrated with the latest version of Istio Service Mesh, we will deploy a reference microservices platform, written in Go, to GKE on GCP. I developed the reference platform to demonstrate concepts such as API management, Service Meshes, Observability, DevOps, and Chaos Engineering. The platform is comprised of (14) components, including (8) Go-based microservices, labeled generically as Service A – Service H, (1) Angular 7, TypeScript-based front-end, (4) MongoDB databases, and (1) RabbitMQ queue for event queue-based communications. The platform and all its source code is free and open source.
The reference platform is designed to generate HTTP-based service-to-service, TCP-based service-to-database (MongoDB), and TCP-based service-to-queue-to-service (RabbitMQ) IPC (inter-process communication). Service A calls Service B and Service C, Service B calls Service D and Service E, Service D produces a message on a RabbitMQ queue that Service F consumes and writes to MongoDB, and so on. These distributed communications can be observed using Istio’s observability tools when the system is deployed to a Kubernetes cluster running the Istio service mesh.
Service Responses
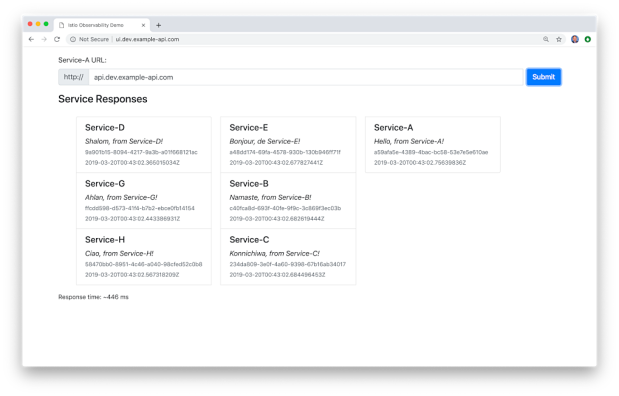
On the reference platform, each upstream service responds to requests from downstream services by returning a small informational JSON payload (termed a greeting in the source code).
The responses are aggregated across the service call chain, resulting in an array of service responses being returned to the edge service and on to the Angular-based UI, running in the end user’s web browser. The response aggregation feature is simply used to confirm that the service-to-service communications, Istio components, and the telemetry tools are working properly.
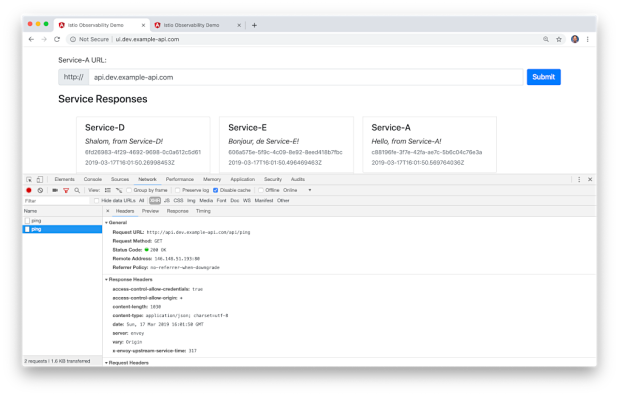
Each Go microservice contains a /ping and /health endpoint. The /health endpoint can be used to configure Kubernetes Liveness and Readiness Probes. Additionally, the edge service, Service A, is configured for Cross-Origin Resource Sharing (CORS) using the access-control-allow-origin: * response header. CORS allows the Angular UI, running in end user’s web browser, to call the Service A /ping endpoint, which resides in a different subdomain from UI. Shown below is the Go source code for Service A.
For this demonstration, the MongoDB databases will be hosted, external to the services on GCP, on MongoDB Atlas, a MongoDB-as-a-Service, cloud-based platform. Similarly, the RabbitMQ queues will be hosted on CloudAMQP, a RabbitMQ-as-a-Service, cloud-based platform. I have used both of these SaaS providers in several previous posts. Using external services will help us understand how Istio and its observability tools collect telemetry for communications between the Kubernetes cluster and external systems.
Shown below is the Go source code for Service F, This service consumers messages from the RabbitMQ queue, placed there by Service D, and writes the messages to MongoDB.
Source Code
All source code for this post is available on GitHub in two projects. The Go-based microservices source code, all Kubernetes resources, and all deployment scripts are located in the k8s-istio-observe-backend project repository. The Angular UI TypeScript-based source code is located in the k8s-istio-observe-frontend project repository. You should not need to clone the Angular UI project for this demonstration.
git clone --branch master --single-branch --depth 1 --no-tags \
  https://github.com/garystafford/k8s-istio-observe-backend.git
Docker images referenced in the Kubernetes Deployment resource files, for the Go services and UI, are all available on Docker Hub. The Go microservice Docker images were built using the official Golang Alpine base image on DockerHub, containing Go version 1.12.0. Using the Alpine image to compile the Go source code ensures the containers will be as small as possible and contain a minimal attack surface.
System Requirements
To follow along with the post, you will need the latest version of gcloud CLI (min. ver. 239.0.0), part of the Google Cloud SDK, Helm, and the just releases Istio 1.1.0, installed and configured locally or on your build machine.
Set-up and Installation
To deploy the microservices platform to GKE, we will proceed in the following order.
- Create the MongoDB Atlas database cluster;
- Create the CloudAMQP RabbitMQ cluster;
- Modify the Kubernetes resources and scripts for your own environments;
- Create the GKE cluster on GCP;
- Deploy Istio 1.1.0 to the GKE cluster, using Helm;
- Create DNS records for the platform’s exposed resources;
- Deploy the Go-based microservices, Angular UI, and associated resources to GKE;
- Test and troubleshoot the platform;
- Observe the results in part two!
MongoDB Atlas Cluster
MongoDB Atlas is a fully-managed MongoDB-as-a-Service, available on AWS, Azure, and GCP. Atlas, a mature SaaS product, offers high-availability, guaranteed uptime SLAs, elastic scalability, cross-region replication, enterprise-grade security, LDAP integration, a BI Connector, and much more.
MongoDB Atlas currently offers four pricing plans, Free, Basic, Pro, and Enterprise. Plans range from the smallest, M0-sized MongoDB cluster, with shared RAM and 512 MB storage, up to the massive M400 MongoDB cluster, with 488 GB of RAM and 3 TB of storage.
For this post, I have created an M2-sized MongoDB cluster in GCP’s us-central1 (Iowa) region, with a single user database account for this demo. The account will be used to connect from four of the eight microservices, running on GKE.
Originally, I started with an M0-sized cluster, but the compute resources were insufficient to support the volume of calls from the Go-based microservices. I suggest at least an M2-sized cluster or larger.
CloudAMQP RabbitMQ Cluster
CloudAMQP provides full-managed RabbitMQ clusters on all major cloud and application platforms. RabbitMQ will support a decoupled, eventually consistent, message-based architecture for a portion of our Go-based microservices. For this post, I have created a RabbitMQ cluster in GCP’s us-central1 (Iowa) region, the same as our GKE cluster and MongoDB Atlas cluster. I chose a minimally-configured free version of RabbitMQ. CloudAMQP also offers robust, multi-node RabbitMQ clusters for Production use.
Modify Configurations
There are a few configuration settings you will need to change in the GitHub project’s Kubernetes resource files and Bash deployment scripts.
Istio ServiceEntry for MongoDB Atlas
Modify the Istio ServiceEntry, external-mesh-mongodb-atlas.yaml file, adding you MongoDB Atlas host address. This file allows egress traffic from four of the microservices on GKE to the external MongoDB Atlas cluster.
apiVersion: networking.istio.io/v1alpha3
kind: ServiceEntry
metadata:
  name: mongodb-atlas-external-mesh
spec:
  hosts:
  - {{ your_host_goes_here }}
  ports:
  - name: mongo
    number: 27017
    protocol: MONGO
  location: MESH_EXTERNAL
  resolution: NONE
Istio ServiceEntry for CloudAMQP RabbitMQ
Modify the Istio ServiceEntry, external-mesh-cloudamqp.yaml file, adding you CloudAMQP host address. This file allows egress traffic from two of the microservices to the CloudAMQP cluster.
apiVersion: networking.istio.io/v1alpha3
kind: ServiceEntry
metadata:
  name: cloudamqp-external-mesh
spec:
  hosts:
  - {{ your_host_goes_here }}
  ports:
  - name: rabbitmq
    number: 5672
    protocol: TCP
  location: MESH_EXTERNAL
  resolution: NONE
Istio Gateway and VirtualService Resources
There are numerous strategies you may use to route traffic into the GKE cluster, via Istio. I am using a single domain for the post, example-api.com, and four subdomains. One set of subdomains is for the Angular UI, in the dev Namespace (ui.dev.example-api.com) and the test Namespace (ui.test.example-api.com). The other set of subdomains is for the edge API microservice, Service A, which the UI calls (api.dev.example-api.com and api.test.example-api.com). Traffic is routed to specific Kubernetes Service resources, based on the URL.
According to Istio, the Gateway describes a load balancer operating at the edge of the mesh, receiving incoming or outgoing HTTP/TCP connections. Modify the Istio ingress Gateway, inserting your own domains or subdomains in the hosts section. These are the hosts on port 80 that will be allowed into the mesh.
apiVersion: networking.istio.io/v1alpha3
kind: Gateway
metadata:
  name: demo-gateway
spec:
  selector:
    istio: ingressgateway
  servers:
  - port:
      number: 80
      name: http
      protocol: HTTP
    hosts:
    - ui.dev.example-api.com
    - ui.test.example-api.com
    - api.dev.example-api.com
    - api.test.example-api.com
According to Istio, a VirtualService defines a set of traffic routing rules to apply when a host is addressed. A VirtualService is bound to a Gateway to control the forwarding of traffic arriving at a particular host and port. Modify the project’s four Istio VirtualServices, inserting your own domains or subdomains. Here is an example of one of the four VirtualServices, in the istio-gateway.yaml file.
apiVersion: networking.istio.io/v1alpha3
kind: VirtualService
metadata:
  name: angular-ui-dev
spec:
  hosts:
  - ui.dev.example-api.com
  gateways:
  - demo-gateway
  http:
  - match:
    - uri:
        prefix: /
    route:
    - destination:
        port:
          number: 80
        host: angular-ui.dev.svc.cluster.local
Kubernetes Secret
The project contains a Kubernetes Secret, go-srv-demo.yaml, with two values. One is for the MongoDB Atlas connection string and one is for the CloudAMQP connections string. Remember Kubernetes Secret values need to be base64 encoded.
apiVersion: v1
kind: Secret
metadata:
  name: go-srv-config
type: Opaque
data:
  mongodb.conn: {{ your_base64_encoded_secret }}
  rabbitmq.conn: {{ your_base64_encoded_secret }}
On Linux and Mac, you can use the base64 program to encode the connection strings.
> echo -n "mongodb+srv://username:password@atlas-cluster.gcp.mongodb.net/test?retryWrites=true" | base64
bW9uZ29kYitzcnY6Ly91c2VybmFtZTpwYXNzd29yZEBhdGxhcy1jbHVzdGVyLmdjcC5tb25nb2RiLm5ldC90ZXN0P3JldHJ5V3JpdGVzPXRydWU=

> echo -n "amqp://username:password@rmq.cloudamqp.com/cluster" | base64
YW1xcDovL3VzZXJuYW1lOnBhc3N3b3JkQHJtcS5jbG91ZGFtcXAuY29tL2NsdXN0ZXI=
Bash Scripts Variables
The bash script, part3_create_gke_cluster.sh, contains a series of environment variables. At a minimum, you will need to change the PROJECT variable in all scripts to match your GCP project name.
# Constants - CHANGE ME!
readonly PROJECT='{{ your_gcp_project_goes_here }}'
readonly CLUSTER='go-srv-demo-cluster'
readonly REGION='us-central1'
readonly MASTER_AUTH_NETS='72.231.208.0/24'
readonly GKE_VERSION='1.12.5-gke.5'
readonly MACHINE_TYPE='n1-standard-2'
The bash script, part4_install_istio.sh, includes the ISTIO_HOME variable. The value should correspond to your local path to Istio 1.1.0. On my local Mac, this value is shown below.
readonly ISTIO_HOME='/Applications/istio-1.1.0'
Deploy GKE Cluster
Next, deploy the GKE cluster using the included bash script, part3_create_gke_cluster.sh. This will create a Regional, multi-zone, 3-node GKE cluster, using the latest version of GKE at the time of this post, 1.12.5-gke.5. The cluster will be deployed to the same region as the MongoDB Atlas and CloudAMQP clusters, GCP’s us-central1 (Iowa) region. Planning where your Cloud resources will reside, for both SaaS providers and primary Cloud providers can be critical to minimizing latency for network I/O intensive applications.
Deploy Istio using Helm
With the GKE cluster and associated infrastructure in place, deploy Istio. For this post, I have chosen to install Istio using Helm, as recommended my Istio. To deploy Istio using Helm, use the included bash script, part4_install_istio.sh.
The script installs Istio, using the Helm Chart in the local Istio 1.1.0 install/kubernetes/helm/istio directory, which you installed as a requirement for this demonstration. The Istio install script overrides several default values in the Istio Helm Chart using the --set, flag. The list of available configuration values is detailed in the Istio Chart’s GitHub project. The options enable Istio’s observability features, which we will explore in part two. Features include Kiali, Grafana, Prometheus, and Jaeger.
helm install ${ISTIO_HOME}/install/kubernetes/helm/istio-init \
  --name istio-init \
  --namespace istio-system

helm install ${ISTIO_HOME}/install/kubernetes/helm/istio \
  --name istio \
  --namespace istio-system \
  --set prometheus.enabled=true \
  --set grafana.enabled=true \
  --set kiali.enabled=true \
  --set tracing.enabled=true

kubectl apply --namespace istio-system \
  -f ./resources/secrets/kiali.yaml
Below, we see the Istio-related Workloads running on the cluster, including the observability tools.
Below, we see the corresponding Istio-related Service resources running on the cluster.
Modify DNS Records
Instead of using IP addresses to route traffic the GKE cluster and its applications, we will use DNS. As explained earlier, I have chosen a single domain for the post, example-api.com, and four subdomains. One set of subdomains is for the Angular UI, in the dev Namespace and the test Namespace. The other set of subdomains is for the edge microservice, Service A, which the API calls. Traffic is routed to specific Kubernetes Service resources, based on the URL.
Deploying the GKE cluster and Istio triggers the creation of a Google Load Balancer, four IP addresses, and all required firewall rules. One of the four IP addresses, the one shown below, associated with the Forwarding rule, will be associated with the front-end of the load balancer.
Below, we see the new load balancer, with the front-end IP address and the backend VM pool of three GKE cluster’s worker nodes. Each node is assigned one of the IP addresses, as shown above.
As shown below, using Google Cloud DNS, I have created the four subdomains and assigned the IP address of the load balancer’s front-end to all four subdomains. Ingress traffic to these addresses will be routed through the Istio ingress Gateway and the four Istio VirtualServices, to the appropriate Kubernetes Service resources. Use your choice of DNS management tools to create the four A Type DNS records.
Deploy the Reference Platform
Next, deploy the eight Go-based microservices, the Angular UI, and the associated Kubernetes and Istio resources to the GKE cluster. To deploy the platform, use the included bash deploy script, part5a_deploy_resources.sh. If anything fails and you want to remove the existing resources and re-deploy, without destroying the GKE cluster or Istio, you can use the part5b_delete_resources.sh delete script.
The deploy script deploys all the resources two Kubernetes Namespaces, dev and test. This will allow us to see how we can differentiate between Namespaces when using the observability tools.
Below, we see the Istio-related resources, which we just deployed. They include the Istio Gateway, four Istio VirtualService, and two Istio ServiceEntry resources.
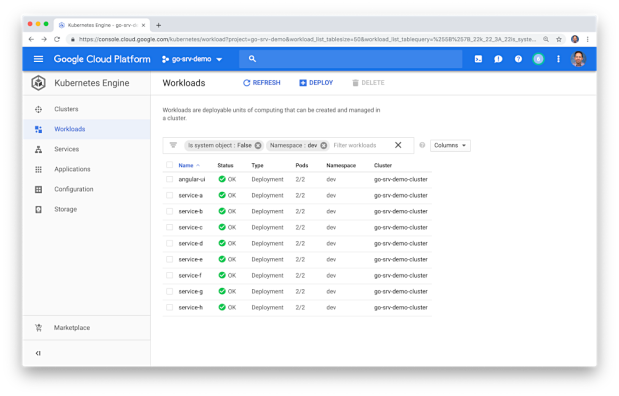
Below, we see the platform’s Workloads (Kubernetes Deployment resources), running on the cluster. Here we see two Pods for each Workload, a total of 18 Pods, running in the dev Namespace. Each Pod contains both the deployed microservice or UI component, as well as a copy of Istio’s Envoy Proxy.
Below, we see the corresponding Kubernetes Service resources running in the dev Namespace.
Below, a similar view of the Deployment resources running in the test Namespace. Again, we have two Pods for each deployment with each Pod contains both the deployed microservice or UI component, as well as a copy of Istio’s Envoy Proxy.
Test the Platform
We do want to ensure the platform’s eight Go-based microservices and Angular UI are working properly, communicating with each other, and communicating with the external MongoDB Atlas and CloudAMQP RabbitMQ clusters. The easiest way to test the cluster is by viewing the Angular UI in a web browser.
The UI requires you to input the host domain of the Service A, the API’s edge service. Since you cannot use my subdomain, and the JavaScript code is running locally to your web browser, this option allows you to provide your own host domain. This is the same domain or domains you inserted into the two Istio VirtualService for the UI. This domain route your API calls to either the FQDN (fully qualified domain name) of the Service A Kubernetes Service running in the dev namespace, service-a.dev.svc.cluster.local, or the test Namespace, service-a.test.svc.cluster.local.
You can also use performance testing tools to load-test the platform. Many issues will not show up until the platform is under load. I recently starting using hey, a modern load generator tool, as a replacement for Apache Bench (ab), Unlike ab, hey supports HTTP/2 endpoints, which is required to test the platform on GKE with Istio. Below, I am running hey directly from Google Cloud Shell. The tool is simulating 25 concurrent users, generating a total of 1,000 HTTP/2-based GET requests to Service A.
Troubleshooting
If for some reason the UI fails to display, or the call from the UI to the API fails, and assuming all Kubernetes and Istio resources are running on the GKE cluster (all green), the most common explanation is usually a misconfiguration of the following resources:
- Your four Cloud DNS records are not correct. They are not pointing to the load balancer’s front-end IP address;
- You did not configure the four Kubernetes
VirtualServiceresources with the correct subdomains; - The GKE-based microservices cannot reach the external MongoDB Atlas and CloudAMQP RabbitMQ clusters. Likely, the Kubernetes
Secretis constructed incorrectly, or the twoServiceEntryresources contain the wrong host information for those external clusters;
I suggest starting the troubleshooting by calling Service A, the API’s edge service, directly, using cURL or Postman. You should see a JSON response payload, similar to the following. This suggests the issue is with the UI, not the API.
Next, confirm that the four MongoDB databases were created for Service D, Service, F, Service, G, and Service H. Also, confirm that new documents are being written to the database’s collections.
Next, confirm new the RabbitMQ queue was created, using the CloudAMQP RabbitMQ Management Console. Service D produces messages, which Service F consumes from the queue.
Lastly, review the Stackdriver logs to see if there are any obvious errors.
Part Two
In part two of this post, we will explore each observability tool, and see how they can help us manage our GKE cluster and the reference platform running in the cluster.
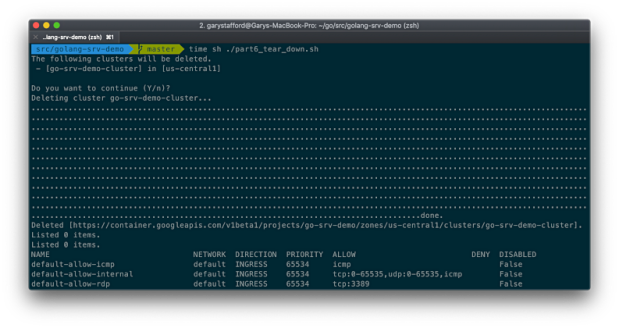
Since the cluster only takes minutes to fully create and deploy resources to, if you want to tear down the GKE cluster, run the part6_tear_down.sh script.
All opinions expressed in this post are my own and not necessarily the views of my current or past employers or their clients.


No comments:
Post a Comment