Monday, November 29, 2021

Setting up super fast Cypress tests on GitHub Actions

If you've been keeping track of The Array release posts you know that we prioritize shipping things fast and often. Just as important to us is being sure that we are not going to break things unnecessarily for our users as we add new features and speedups.

What we have found that works really well is nothing terribly novel by itself: a solid foundation of unit tests, end to end tests (integration tests), and CI/CD that for automation and gatekeeper keeping master clean.

Unit & Integration tests

In our Django codebase you'll find good number of Django tests that help keep us honest as we hack away at the backend of PostHog that keeps track of all the 1's and 0's that our customers depend on for making product decisions. These are our frontline defenders that let us know that something might be up before we even get to the point of creating a PR.

For this we do lean heavily on the standard Django test runner.

If you are interested in learning more on testing with Django check out Django's great docs on testing.

These tests only get you so far though. You know that the backend is going to behave well after you land the changes that you've made, but what if you accidentally changed something that breaks the frontend in weird and unexpected ways?

Enter Cypress

According to Cypress's GitHub repo it is a fast, easy and reliable testing for anything that runs in a browser. What does that mean exactly though?

It lets you programmatically interact with your application by querying the DOM and running actions against any selected elements. You can see that in a few of our Cypress test definitions

Tracking the elements

To keep our tested elements clear, manageable, and reusable upon refactor, we take advantage of the element attributes that html and react specifically recognize. Cypress has an amazing built in inspector on their test-runner that allows you to identify elements that you would like to add tests to.

While the tool works great, we found that occasionally the heavily nested components and classes would create selectors that were inflexible.

With the data-attr tag, we just need to keep track of the tag when updating/changing the components we're using without needing to rely on the inspector to find the precise selector for the test!

<LineGraph
data-attr="trend-line-graph"
{...props}
/>

Example of our integration test for our Funnel user experience:

describe('Funnels', () => {
//boilerplate to make sure we are on the funnel page of the app
beforeEach(() => {
cy.get('[data-attr=menu-item-funnels]').click()
})
// Test to make sure that the funnel page actually loaded
it('Funnels loaded', () => {
cy.get('h1').should('contain', 'Funnels')
})
// Test that when we select a funnel then we can edit that funnel
it('Click on a funnel', () => {
cy.get('[data-attr=funnel-link-0]').click()
cy.get('[data-attr=funnel-editor]').should('exist')
})
// Test that we can create a new funnel when we click 'create funnel' button
it('Go to new funnel screen', () => {
cy.get('[data-attr=create-funnel]').click()
cy.get('[data-attr=funnel-editor]').should('exist')
})
// Test that we can create a new funnel end to end
it('Add 1 action to funnel', () => {
cy.get('[data-attr=create-funnel]').click()
cy.get('[data-attr=funnel-editor]').should('exist')
cy.get('[data-attr=edit-funnel-input]').type('Test funnel')
cy.get('[data-attr=add-action-event-button]').click()
cy.get('[data-attr=trend-element-subject-0]').click()
cy.contains('Pageviews').click()
cy.get('[data-attr=save-funnel-button]').click()
cy.get('[data-attr=funnel-viz]').should('exist')
})
})

I personally love this syntax. It feels super readable to me and reminds me a bit of the best parts of jQuery.

GitHub Actions

So that's all well and cool, but what about making sure that in a fit of intense focus and momentum we don't inadvertently push a breaking change to master? We need someone or something to act as a gatekeeper to keep us from from shooting ourselves in the foot. We need CI.

We could use Travis, or Jekins, or CircleCI… but as you may have noticed we keep almost everything about PostHog in GitHub, from our product roadmap, issues, this blog, everything is in GitHub. So it made sense to us to keep our CI in GitHub if we could. We decided to give GitHub Actions a test. So far, we have loved it.

GitHub actions are basically a workflow you can trigger from events that occure on your GitHub repo. We trigger ours on the creation of a pull request. We also require that our actions all return 👍  before you can merge your PR into master. Thus, we keep master clean.

To make sure that things are only improving with our modifications, we first re-run our Django unit and integration tests just to make sure that in our customers final environment things are still going to behave as expected. We need to be sure that there was nothing unique about your dev environment that could have fooled the tests into a false sense of awesome. You can check out how we set this up here Django github actions

The second round of poking we do with our app is we hit it with Cypress tests that we discussed earlier. These boot up our app and click through workflows just as a user would, asserting along the way that things look and behave as we would expect. You can check out how we've setup our Cypress action here

Caching

We ran up upon an issue though. Installing python dependencies, javascript dependencies, building our frontend app, booting up a chromium browser… this all takes a lot of time. We are impatient. We want instant gratifiction, at least when it comes to our code. Most of this stuff doesn't even change between commits on a PR anyways. Why are we spending valuable time and resources towards having things be repulled and rebuilt? That's where we ended up using one of the best features of GitHub Actions: the cache step.

Using the cache step we can cache the results of pulling python dependencies or javascript dependencies. This saves a chunk of time if you have ever messed around with watching yarn sort out the deps for a large frontend project. Check it out:

How we manage caching the cache for pip:

- uses: actions/cache@v1
name: Cache pip dependencies
id: pip-cache
with:
path: ~/.cache/pip
key: ${{ runner.os }}-pip-${{ hashFiles('**/requirements.txt') }}
restore-keys: |
${{ runner.os }}-pip-
- name: Install python dependencies
run: |
python -m pip install --upgrade pip
python -m pip install $(grep -ivE "psycopg2" requirements.txt) --no-cache-dir --compile
python -m pip install psycopg2-binary --no-cache-dir --compile

Note that there is no if block to determine whether to use the cache or not when we pip install the dependencies. This is because pip is smart enough to use the rehydrated cache if it sees it, if it doesnt see it it will just go out to the internet to grab what it needs.

Yarn is a bit more involved only because we grab the location of the cache directory first and use that output as an input to the caching step

Yarn dependency caching

- name: Get yarn cache directory path
id: yarn-dep-cache-dir-path
run: echo "::set-output name=dir::$(yarn cache dir)"
- uses: actions/cache@v1
name: Setup Yarn dep cache
id: yarn-dep-cache
with:
path: ${{ steps.yarn-dep-cache-dir-path.outputs.dir }}
key: ${{ runner.os }}-yarn-dep-${{ hashFiles('**/yarn.lock') }}
restore-keys: |
${{ runner.os }}-yarn-dep-
- name: Yarn install deps
run: |
yarn install --frozen-lockfile
if: steps.yarn-dep-cache.outputs.cache-hit != 'true'

That last line with the if block tells GitHub to not run yarn install if the cache exists. This saves us a ton of time if nothing has changed

On top of that, let's say you are making changes to only the API. There's no reason why you should be rebuiling the frontend each time the tests are run. So we go ahead and cache that between runs as well.

Frontend app build cache

- uses: actions/cache@v1
name: Setup Yarn build cache
id: yarn-build-cache
with:
path: frontend/dist
key: ${{ runner.os }}-yarn-build-${{ hashFiles('frontend/src/') }}
restore-keys: |
${{ runner.os }}-yarn-build-
- name: Yarn build
run: |
yarn build
if: steps.yarn-build-cache.outputs.cache-hit != 'true'

Now you are catching if the cache exists so we can skip building the frontend altogether since it's been rehydrated from the last run. Nifty!

Throw more computers at it!

One of the best thing about Cypress is that you can grow with it. It would be a real pain if you invested all of this time into building out tests just to have your test suite take 60 minutes to run. Luckily both GitHub actions and Cypress have a solution to that!

Run it in parallel!

matrix:
# run 4 copies of the current job in parallel
containers: [1, 2, 3, 4]

Configure Cypress step to coordinate with Cypress SaaS

- name: Cypress run
uses: cypress-io/github-action@v1
with:
config-file: cypress.json
record: true
parallel: true
group: 'PostHog Frontend'
env:
# pass the Dashboard record key as an environment variable
CYPRESS_RECORD_KEY: ${{ secrets.CYPRESS_RECORD_KEY }}
# Recommended: pass the GitHub token lets this action correctly
# determine the unique run id necessary to re-run the checks
GITHUB_TOKEN: ${{ secrets.GITHUB_TOKEN }}

Depending on the count of tests and the frequency you are running your suite this might cost you some money having to upgrade your account on Cypress.io but their free tier is pretty generous and they do have OSS plans that are free.

This all has cut the time it takes for GitHub to stamp our pull requests from >10 minutes to ~5 minutes and that's with our relatively small set of tests.

As we grow functionality within PostHog all of this will only become more important so that we don't end up with a 30 minute end to end test blocking you from landing that really killer new feature. Sweet.

👀 at errors

The final bit here is what happens if the tests are failing?

If this is all happening in a browser up in the cloud how do we capture what went wrong? We need that to figure out how to fix it. Luckily, again, Cypress and GitHub actions has a solution: artifacts.

Artifacts allow us to take the screenshots that Cypress takes when things go wrong, zip them up, and make them available on the dashboard for the actions that are being run.

Capturing Cypress screenshots

- name: Archive test screenshots
uses: actions/upload-artifact@v1
with:
name: screenshots
path: cypress/screenshots
if: ${{ failure() }}

As you can tell by the if block here, we only upload the artifacts if there is a problem. That's because we already know what the app will look like when things go right… hopefully 😜

Roadmap

There is one thing that we don't capture in our current test suite: Performance!

We have customers who upload hundreds of telemetry events a second. If we introduce a regression that dings performance this could cause an outage for them where they lose data which is arguably worse than a regression on the frontend.

Our plan here use GitHub actions to standup an instance of our infrastructure and hammer it with sythentic event telemetry and compare that against a baseline from prior performance tests. If the test runtime changes materially we will block the pull request from being merged in to guard master from having a potentially breaking change. Stay tuned for a post on automated performance testing.

The pitch™

Hey! You made it this far. If you see yourself working on challenging issues at a high paced startup with a really rad group of people. You are in luck! We are looking for people like you!
Sunday, November 21, 2021

Azure DevOps agent with Docker Compose

 Using Docker commands in pipeline definition is nice, but has some drawbacks: First of all this approach suffers in speed of execution, because the container must start each time you run a build (and should be stopped at the end of the build). Is indeed true that if the docker image is already present in the agent machine startup time is not so high, but some images, like MsSql, are not immediately operative, so you need to wait for them to be ready for Every Build. The alternative is leave them running even if the build is finished, but this could lead to resource exaustion.

Another problem is dependency from Docker engine. If I include docker commands in build definition, I can build only on a machine that has Docker Installed. If most of my projects uses MongoDb, MsSql and Redis, I can simple install all three on my build machine maybe using a fast SSD as storage. In that scenario I’m expecting to use my physical instances, not waiting for docker to spin new container.

Including Docker Commands in pipeline definition is nice, but it tie the pipeline to Docker and can have a penalty in execution speed

What I’d like to do is leverage docker to spin out an agent and all needed dependencies once, then use that agent with a standard build that does not require docker. This gives me the flexibility of setting up a build machine with everything preinstalled, or to simply use Docker to spin out in seconds an agent that can build my code. Removing Docker dependency from my pipeline definition gave user the most flexibility.

For my first experiment I want also use Docker in Windows 2109 to leverage Windows Container.

First of all you can read the nice MSDN article about how to create a Windows Docker image that downloads, install and run an agent inside a Windows server machine with Docker for Windows. This allows you to spin out a new Docker Agent based on Windows image in minutes (just the time to download and configure the agent).

Thanks to Windows Containers, running an Azure DevOps agent based on Windows is a simple Docker Run command.

Now I need that agent to being able to use MongoDb and MsSql to run integration tests. Clearly I can install both db engine on my host machine and let docker agent to use them, but since I’ve already my agent in Docker I wish for dependencies to run also in Docker ; so… welcome Docker Compose.

Thanks to Docker Compose I can define a YAML file with a list of images that are part of a single sceanrio so I specified an Agent image followed by a Sql Server and a MongoDb images. The beauty of Docker-compose is the ability to refer to other container machines by name. Lets do an example: here is my complete docker compose YML file.

 1
 2
 3
 4
 5
 6
 7
 8
 9
10
11
12
13
14
15
16
17
18
19
20
21
22
23
24
25
26
version: '2.4'

services:
  agent:
    image: dockeragent:latest
    environment:
      - AZP_TOKEN=efk5g3j344xfizar12duju65r34llyw4n7707r17h1$36o6pxsa4q
      - AZP_AGENT_NAME=mydockeragent
      - AZP_URL=https://dev.azure.com/gianmariaricci
      - NSTORE_MONGODB=mongodb://mongo/nstoretest
      - NSTORE_MSSQL=Server=mssql;user id=sa;password=sqlPw3$secure

  mssql:
    image: mssqlon2019:latest
    environment:
      - sa_password=sqlPw3$secure
      - ACCEPT_EULA=Y

    ports:
      - "1433:1433"

  mongo:
    platform: linux
    image: mongo
    ports:
      - "27017:27017"

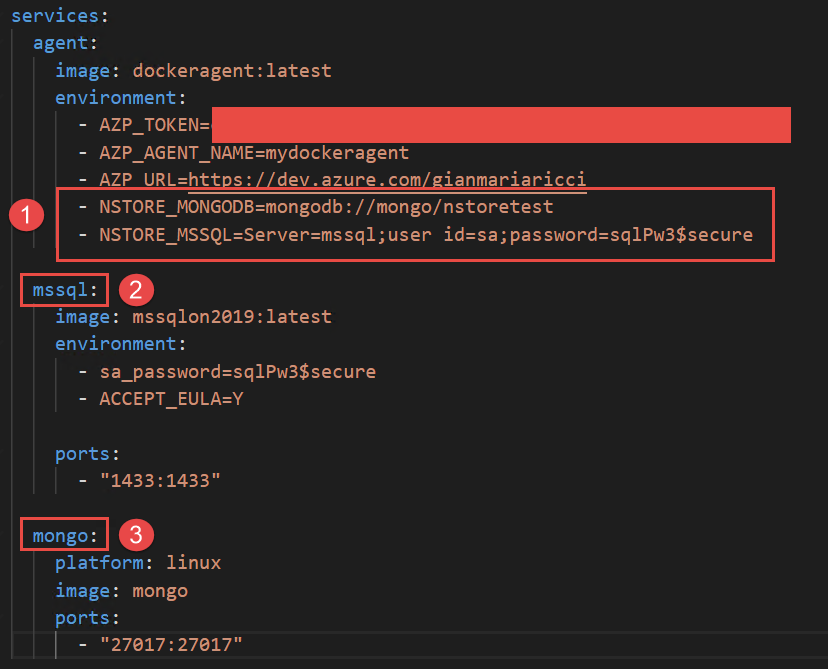
To simplify everything all of my integration tests that needs a connection string to MsSql or MongoDb grab the connection string by environment variable. This is convenient so each developer can use db instances of choice but also this technique makes super easy to configure a Docker agent specifying database connection strings as seen in Figure 1. I can specify in environment variables connection string to use for testing and I can simply use other docker service names directly in connection string.

image

Figure 1Environment variable to specify connection string.

As you can see (1) connection strings refers to other containers by name, nothing could be easier.

The real advantage of using Docker Compose is the ability to include Docker Compose file (as well as dockerfiles for all custom images that you could need)  inside your source code. With this approach you can specify build pipelines leveraging YAML build of Azure DevOps and also the configuration of the agent with all dependencies. Since you can configure as many Agent you want for Azure DevOps (you actually pay for number of concurrent executing pipeline) thanks to Docker Compose you can setup an agent suitable for your project in less than one minutes. But this is optional, if you do not like to use Docker compose, you can simply setup an agent manually, just as you did before.

Including a docker compose file in your source code allows consumer of the code to start a compatible agent with a single command.

Thanks to docker compose, you pay the price of downloading pulling images once, also you are paying only once the time needed for any image to become operative (like MsSql or other databases that needs a little bit before being able to satisfy requests). After everything is up and running, your agent is operative and can immediately run your standard builds, no docker reference inside your YAML build file, no time wasted in waiting your images to become operational.

Thanks to experimental feature of Windows Server2019, I was able to specify a docker-compose file that contains not only windows images, but also Linux images. The only problem I had is that I did not find a Windows 2019 Image for Sql Server. I started getting error using standard MsSql images (build for windows 2016); So I decided to download official Docker file, change reference image and recreate the image and everything worked like a charm.

image

Figure 2Small modification to Sql Server docker windows image file, targeting Windows Server 2019.

Since it is used only for test, I’m pretty confident that it should work and indeed my build runs just fine.

image

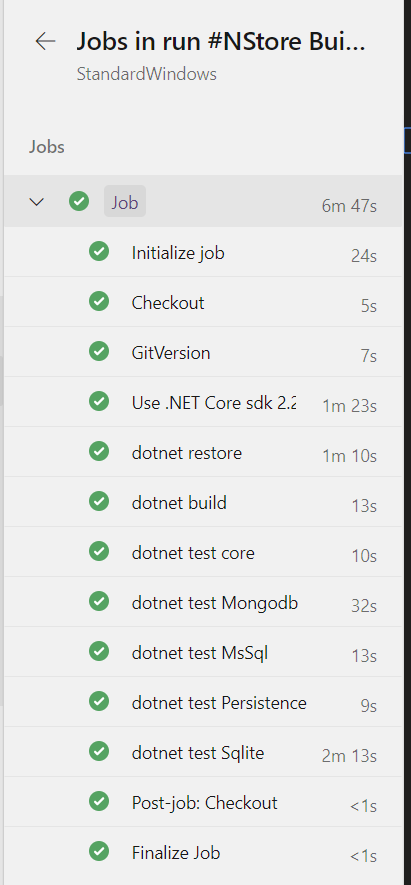
Figure 3My build result, ran on docker agent.

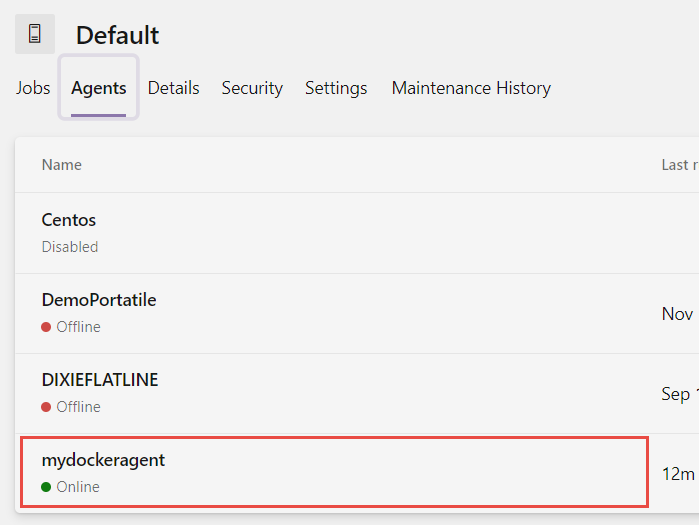
Actually my agent created with Docker Compose is absolutely equal to all other agentw, from the point of view of Azure DevOps it has nothing different, but I’ve started it with a single line of Docker-Compose command

image

Figure 4Agent running in docker it is treated as standard agents.

That’s all, with a little effort I’m able to include in my source code both YAML build definition as YAML Docker Compose file to specify the agent with all prerequisites to ran the build. This is especially useful for Open Source projects, where you want to fork a project then activate CI with no effort.

Docker DevOps to deploy an ExpressJS app to Azure using DockerHub

 This docker architecture will create a continuous integration and deployment pipeline using GitHub for code repository, DockerHub for Docker image repository and Azure for deploying the app through Docker containers.

After the whole setup, you will be able to make code changes. Once you push the changes to GitHub to the branches you have created, it will automatically be deployed to Azure.

Backstory

If you are asking why Azure instead of AWS or GCloud, I feel you. As many developers working on their personal projects, we rely on free subscriptions and free credits. For me, I had more credits with Azure. It was working fine for some time. Then, it started acting up. By that, I mean really acting up. I got all sorts of errors while deploying the application (PS: I did not get any issues with AWS). It was all library issues. It was giving all sorts of npm package not found/module not found errors. Before these errors, it was working fine for about 2 months. That’s what I get for depending on the Azure machines blindly. So, one morning, I just decided to dockerize the whole app and deploy it to Azure.

Solving through Dockers

I decided to use Docker Containers to get rid of Azure’s soap opera drama. Let me give you a brief overview of what Docker is and how it solves all the deployment issues.

If you are already familiar with Docker, you can skip to Step 1.

What’s Docker?

It is basically a tool that allows us to create, deploy and run our applications using a container. Docker containers allow us to package our entire application (libraries and all dependencies) and ships it as one package. This way you don’t care where you are deploying your application or what libraries the hosting machine has. You will have everything you need inside a container you create. You are in charge here.

A traditional flow is:

You have an application > Create a docker image with all dependencies you need > Run a container.

I cannot explain the whole docker in a paragraph but Docker solves many issues. Especially, if you are a Data Scientist and running multiple Machine Learning models, deploying them to multiple machines gives all sorts of library version mismatch problems. I have personally had them in past projects. With Docker, you don’t have to hire an extra person for solving deployment issues because chances are you won’t have any.

More on Docker: follow this and this.

Prerequisites

You at least need these accounts to get started with. Follow the links if you don’t have one.

  1. GitHub repo
  2. DockerHub account setup
  3. MS Azure account

Assumption

I am assuming that you already have some knowledge of Git and you already have a project in GitHub. If you are looking at this article, you probably have a project and want to deploy it to the cloud.

Step 1: Create a Dockerfile in the root of your Express project

If you don’t have a project setup, please follow instructions on express-generator or boilerplate here with nodemon and babel already setup. Then, set it up with GitHub.

Create a Dockerfile in the root of your project. Dockerfile is a document with all the commands that docker build builds the image from.

FROM mhart/alpine-node:8WORKDIR /appRUN npm installRUN npm run buildCOPY . /app/EXPOSE 3000CMD [ “npm”, “start” ]

The above code creates an image from alpine-node as a base image. I am using alpine-node because it is very light compared to the official node image.

alpine-node image size: ~65 MB
Official Node Image: ~900 MB

Create .dockerignore file

Once you are done with Dockerfile, create a .dockerignore file. Similar to .gitignore, this file ignores the files/directories mentioned inside the file. Typically, a starter Express projects can have these files:

node_modules
npm-debug.log

We want to exclude node_modules because when building the image, we are doing npm install in the Dockerfile.

Since we will be building Docker images through GitHub, you don’t need to include node_modules but it helps if you are trying to build locally.

You can test this locally by creating an image in docker locally. You need a docker app for your windows/Mac. However, for preventing this article from being too long, I won’t go into local builds.

Step 2: Create a Docker Repository and connect it to GitHub

You need to create a docker repository first. You can create one docker repository for each GitHub project. You can have multiple images for different branches. So, if you plan on having different stages of your application like DEV, TEST, and PROD, you can do so by creating multiple docker images with tags like dev, prod, test. You need to have your images in your remote repository so that Azure can continuously deploy from your app’s image. We will use the DockerHub. Once you login into DockerHub, create a repository

  1. Select your GitHub user name and the repository you want to create docker image for.
  2. Customize the build settings to create different images for different branches. For this scenario, we will do 2 images: one for production and one for development.
  3. Docker Tags are important as they differentiate your images.
  4. Enter the Dockerfile location from the root of your project. Usually, Dockerfiles are kept in the root of the project.
  5. Also, select Autobuild so that when you push code changes to GitHub, docker image automatically rebuilds.
  6. When you have everything filled out, create and build.

If you do not see Autobuild option, go to your repository > builds > Configure Automated Build

You can check the build process through the Build tab. You cannot miss it.

Step 3: Running the docker image in Azure’s container

After your image build has passed, head over to Azure Portal to create a project. We’ll create a continuous deployment in Azure Web App by pointing it to DockerHub.

For the purpose of this tutorial, we will stick with Single Container deployment because both Docker Compose and Kubernetes in Azure are in the “Preview” currently. If you want to deploy multiple containers in a single environment, go with other options. However, if you are done with the basics and are interested in doing more, you should checkout Kubernetes. It’s very cool.

Follow the instructions below

  1. After logging in to Azure Portal, create a resource and search for Web App. Create a web app
  2. Enter the name for the web app, subscriptions, resource group, and all the required fields on the left-hand side.
  3. In Publish, choose docker. Then, you will see a new option Configure Container.
  4. Go to configure container and choose Single Container -> Docker. Depending on the public/private DockerHub image, you will be asked to enter credentials. Enter DockerHub credentials for private repo.
  5. In the image option: enter the name in the specified format: {userAccount}/{repo name}:{tag name}
  6. Tag names are dev and prod we created earlier.
  7. You can leave the Startup File empty.
  8. Apply the changes and create.
  9. After the resource is created, open it and go to Container Settings to turn on the Continuous Deployment. This is where the magic happens (not really magic)

Step 4: Adding environment variables

This is an optional step if you have the environment variables you haven’t included with the project.

This step is necessary when you have different environments like DEV and PROD and you don’t want to keep sensitive information in your GitHub because you don’t want all developers knowing your credentials to various APIs, secret keys and other tool credentials.

You can enter the environment variables used by your Express app directly into Application Settings in Azure. It will be accessible to your Node application. For example, if you want to run the app differently according to NODE_ENV variable like:

if (process.env.NODE_ENV == ‘production’) {// Do something when NODE_ENV is for productionelse {// Do something if it is not.// If you provided other environment keys through Azure, you can      access it in Express code like process.env.DATABASE_PASSWORD// It is if you provided DATABASE_PASSWORD in Azure’s Application Settings the same way as NODE_ENV}

For adding the environment variables in Azure, go to Application Settings and add the variables there like below: