Sunday, November 21, 2021

Azure DevOps agent with Docker Compose

 Using Docker commands in pipeline definition is nice, but has some drawbacks: First of all this approach suffers in speed of execution, because the container must start each time you run a build (and should be stopped at the end of the build). Is indeed true that if the docker image is already present in the agent machine startup time is not so high, but some images, like MsSql, are not immediately operative, so you need to wait for them to be ready for Every Build. The alternative is leave them running even if the build is finished, but this could lead to resource exaustion.

Another problem is dependency from Docker engine. If I include docker commands in build definition, I can build only on a machine that has Docker Installed. If most of my projects uses MongoDb, MsSql and Redis, I can simple install all three on my build machine maybe using a fast SSD as storage. In that scenario I’m expecting to use my physical instances, not waiting for docker to spin new container.

Including Docker Commands in pipeline definition is nice, but it tie the pipeline to Docker and can have a penalty in execution speed

What I’d like to do is leverage docker to spin out an agent and all needed dependencies once, then use that agent with a standard build that does not require docker. This gives me the flexibility of setting up a build machine with everything preinstalled, or to simply use Docker to spin out in seconds an agent that can build my code. Removing Docker dependency from my pipeline definition gave user the most flexibility.

For my first experiment I want also use Docker in Windows 2109 to leverage Windows Container.

First of all you can read the nice MSDN article about how to create a Windows Docker image that downloads, install and run an agent inside a Windows server machine with Docker for Windows. This allows you to spin out a new Docker Agent based on Windows image in minutes (just the time to download and configure the agent).

Thanks to Windows Containers, running an Azure DevOps agent based on Windows is a simple Docker Run command.

Now I need that agent to being able to use MongoDb and MsSql to run integration tests. Clearly I can install both db engine on my host machine and let docker agent to use them, but since I’ve already my agent in Docker I wish for dependencies to run also in Docker ; so… welcome Docker Compose.

Thanks to Docker Compose I can define a YAML file with a list of images that are part of a single sceanrio so I specified an Agent image followed by a Sql Server and a MongoDb images. The beauty of Docker-compose is the ability to refer to other container machines by name. Lets do an example: here is my complete docker compose YML file.

 1
 2
 3
 4
 5
 6
 7
 8
 9
10
11
12
13
14
15
16
17
18
19
20
21
22
23
24
25
26
version: '2.4'

services:
  agent:
    image: dockeragent:latest
    environment:
      - AZP_TOKEN=efk5g3j344xfizar12duju65r34llyw4n7707r17h1$36o6pxsa4q
      - AZP_AGENT_NAME=mydockeragent
      - AZP_URL=https://dev.azure.com/gianmariaricci
      - NSTORE_MONGODB=mongodb://mongo/nstoretest
      - NSTORE_MSSQL=Server=mssql;user id=sa;password=sqlPw3$secure

  mssql:
    image: mssqlon2019:latest
    environment:
      - sa_password=sqlPw3$secure
      - ACCEPT_EULA=Y

    ports:
      - "1433:1433"

  mongo:
    platform: linux
    image: mongo
    ports:
      - "27017:27017"

To simplify everything all of my integration tests that needs a connection string to MsSql or MongoDb grab the connection string by environment variable. This is convenient so each developer can use db instances of choice but also this technique makes super easy to configure a Docker agent specifying database connection strings as seen in Figure 1. I can specify in environment variables connection string to use for testing and I can simply use other docker service names directly in connection string.
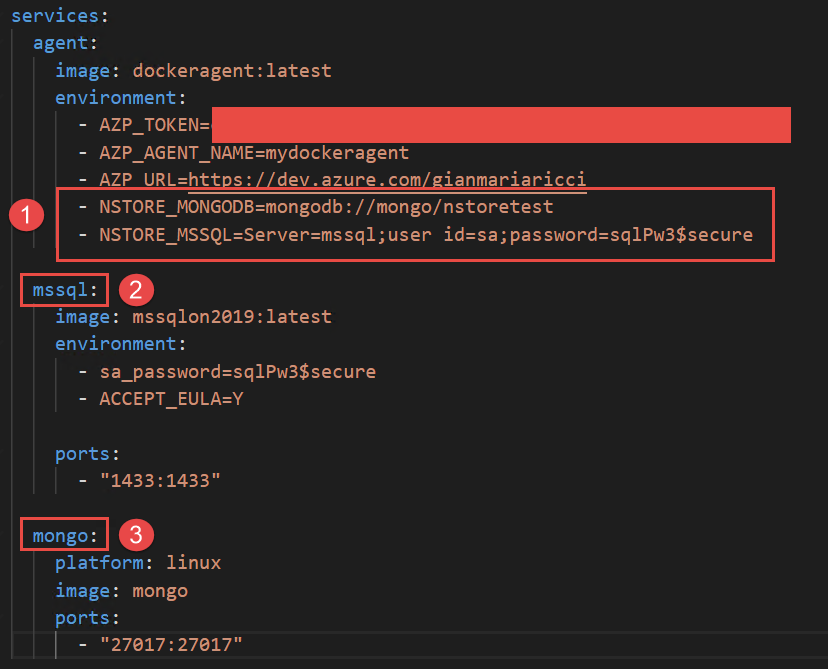
image

Figure 1Environment variable to specify connection string.

As you can see (1) connection strings refers to other containers by name, nothing could be easier.

The real advantage of using Docker Compose is the ability to include Docker Compose file (as well as dockerfiles for all custom images that you could need)  inside your source code. With this approach you can specify build pipelines leveraging YAML build of Azure DevOps and also the configuration of the agent with all dependencies. Since you can configure as many Agent you want for Azure DevOps (you actually pay for number of concurrent executing pipeline) thanks to Docker Compose you can setup an agent suitable for your project in less than one minutes. But this is optional, if you do not like to use Docker compose, you can simply setup an agent manually, just as you did before.

Including a docker compose file in your source code allows consumer of the code to start a compatible agent with a single command.

Thanks to docker compose, you pay the price of downloading pulling images once, also you are paying only once the time needed for any image to become operative (like MsSql or other databases that needs a little bit before being able to satisfy requests). After everything is up and running, your agent is operative and can immediately run your standard builds, no docker reference inside your YAML build file, no time wasted in waiting your images to become operational.

Thanks to experimental feature of Windows Server2019, I was able to specify a docker-compose file that contains not only windows images, but also Linux images. The only problem I had is that I did not find a Windows 2019 Image for Sql Server. I started getting error using standard MsSql images (build for windows 2016); So I decided to download official Docker file, change reference image and recreate the image and everything worked like a charm.
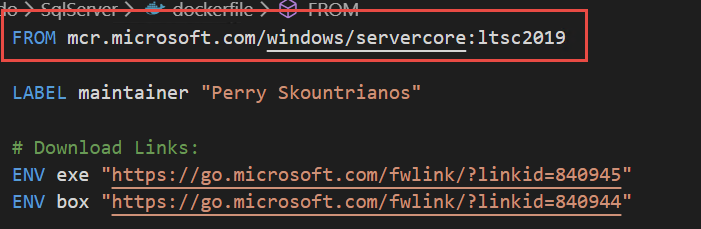
image

Figure 2Small modification to Sql Server docker windows image file, targeting Windows Server 2019.

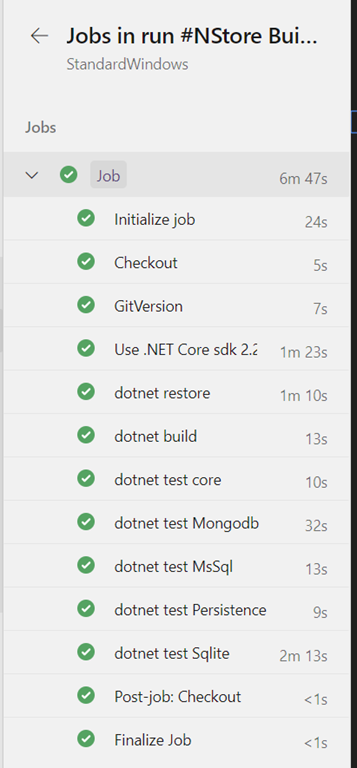
Since it is used only for test, I’m pretty confident that it should work and indeed my build runs just fine.
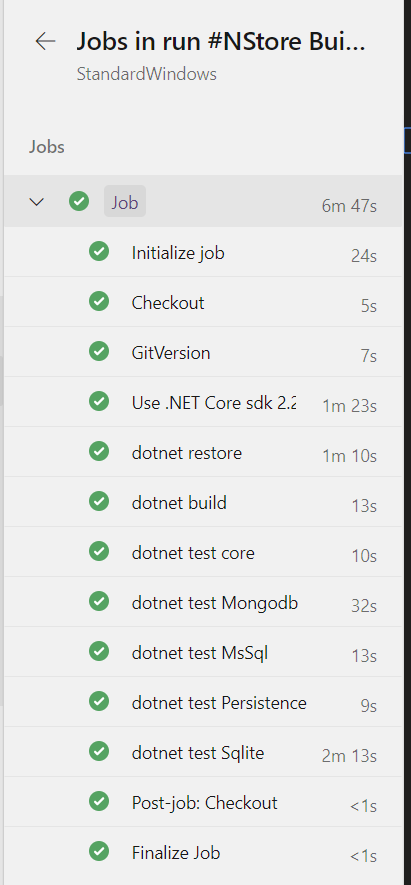
image

Figure 3My build result, ran on docker agent.

Actually my agent created with Docker Compose is absolutely equal to all other agentw, from the point of view of Azure DevOps it has nothing different, but I’ve started it with a single line of Docker-Compose command
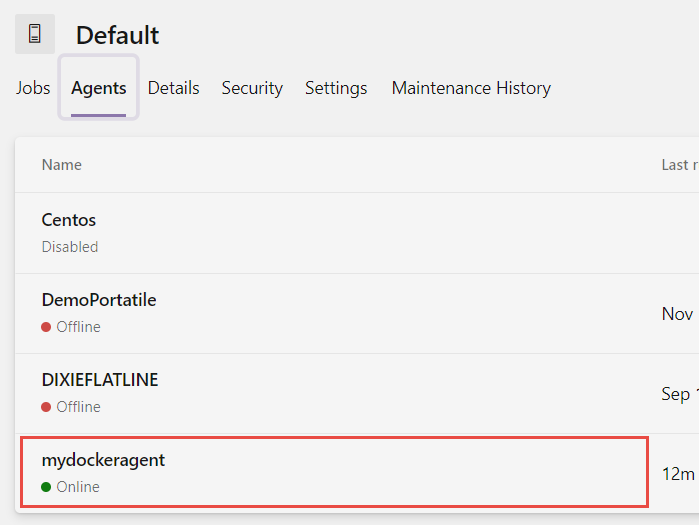
image

Figure 4Agent running in docker it is treated as standard agents.

That’s all, with a little effort I’m able to include in my source code both YAML build definition as YAML Docker Compose file to specify the agent with all prerequisites to ran the build. This is especially useful for Open Source projects, where you want to fork a project then activate CI with no effort.

Docker DevOps to deploy an ExpressJS app to Azure using DockerHub

 This docker architecture will create a continuous integration and deployment pipeline using GitHub for code repository, DockerHub for Docker image repository and Azure for deploying the app through Docker containers.

After the whole setup, you will be able to make code changes. Once you push the changes to GitHub to the branches you have created, it will automatically be deployed to Azure.

Backstory

If you are asking why Azure instead of AWS or GCloud, I feel you. As many developers working on their personal projects, we rely on free subscriptions and free credits. For me, I had more credits with Azure. It was working fine for some time. Then, it started acting up. By that, I mean really acting up. I got all sorts of errors while deploying the application (PS: I did not get any issues with AWS). It was all library issues. It was giving all sorts of npm package not found/module not found errors. Before these errors, it was working fine for about 2 months. That’s what I get for depending on the Azure machines blindly. So, one morning, I just decided to dockerize the whole app and deploy it to Azure.

Solving through Dockers

I decided to use Docker Containers to get rid of Azure’s soap opera drama. Let me give you a brief overview of what Docker is and how it solves all the deployment issues.

If you are already familiar with Docker, you can skip to Step 1.

What’s Docker?

It is basically a tool that allows us to create, deploy and run our applications using a container. Docker containers allow us to package our entire application (libraries and all dependencies) and ships it as one package. This way you don’t care where you are deploying your application or what libraries the hosting machine has. You will have everything you need inside a container you create. You are in charge here.

A traditional flow is:

You have an application > Create a docker image with all dependencies you need > Run a container.

I cannot explain the whole docker in a paragraph but Docker solves many issues. Especially, if you are a Data Scientist and running multiple Machine Learning models, deploying them to multiple machines gives all sorts of library version mismatch problems. I have personally had them in past projects. With Docker, you don’t have to hire an extra person for solving deployment issues because chances are you won’t have any.

More on Docker: follow this and this.

Prerequisites

You at least need these accounts to get started with. Follow the links if you don’t have one.

  1. GitHub repo
  2. DockerHub account setup
  3. MS Azure account

Assumption

I am assuming that you already have some knowledge of Git and you already have a project in GitHub. If you are looking at this article, you probably have a project and want to deploy it to the cloud.

Step 1: Create a Dockerfile in the root of your Express project

If you don’t have a project setup, please follow instructions on express-generator or boilerplate here with nodemon and babel already setup. Then, set it up with GitHub.

Create a Dockerfile in the root of your project. Dockerfile is a document with all the commands that docker build builds the image from.

FROM mhart/alpine-node:8WORKDIR /appRUN npm installRUN npm run buildCOPY . /app/EXPOSE 3000CMD [ “npm”, “start” ]

The above code creates an image from alpine-node as a base image. I am using alpine-node because it is very light compared to the official node image.

alpine-node image size: ~65 MB
Official Node Image: ~900 MB

Create .dockerignore file

Once you are done with Dockerfile, create a .dockerignore file. Similar to .gitignore, this file ignores the files/directories mentioned inside the file. Typically, a starter Express projects can have these files:

node_modules
npm-debug.log

We want to exclude node_modules because when building the image, we are doing npm install in the Dockerfile.

Since we will be building Docker images through GitHub, you don’t need to include node_modules but it helps if you are trying to build locally.

You can test this locally by creating an image in docker locally. You need a docker app for your windows/Mac. However, for preventing this article from being too long, I won’t go into local builds.

Step 2: Create a Docker Repository and connect it to GitHub

You need to create a docker repository first. You can create one docker repository for each GitHub project. You can have multiple images for different branches. So, if you plan on having different stages of your application like DEV, TEST, and PROD, you can do so by creating multiple docker images with tags like dev, prod, test. You need to have your images in your remote repository so that Azure can continuously deploy from your app’s image. We will use the DockerHub. Once you login into DockerHub, create a repository

  1. Select your GitHub user name and the repository you want to create docker image for.
  2. Customize the build settings to create different images for different branches. For this scenario, we will do 2 images: one for production and one for development.
  3. Docker Tags are important as they differentiate your images.
  4. Enter the Dockerfile location from the root of your project. Usually, Dockerfiles are kept in the root of the project.
  5. Also, select Autobuild so that when you push code changes to GitHub, docker image automatically rebuilds.
  6. When you have everything filled out, create and build.

If you do not see Autobuild option, go to your repository > builds > Configure Automated Build

You can check the build process through the Build tab. You cannot miss it.

Step 3: Running the docker image in Azure’s container

After your image build has passed, head over to Azure Portal to create a project. We’ll create a continuous deployment in Azure Web App by pointing it to DockerHub.

For the purpose of this tutorial, we will stick with Single Container deployment because both Docker Compose and Kubernetes in Azure are in the “Preview” currently. If you want to deploy multiple containers in a single environment, go with other options. However, if you are done with the basics and are interested in doing more, you should checkout Kubernetes. It’s very cool.

Follow the instructions below

  1. After logging in to Azure Portal, create a resource and search for Web App. Create a web app
  2. Enter the name for the web app, subscriptions, resource group, and all the required fields on the left-hand side.
  3. In Publish, choose docker. Then, you will see a new option Configure Container.
  4. Go to configure container and choose Single Container -> Docker. Depending on the public/private DockerHub image, you will be asked to enter credentials. Enter DockerHub credentials for private repo.
  5. In the image option: enter the name in the specified format: {userAccount}/{repo name}:{tag name}
  6. Tag names are dev and prod we created earlier.
  7. You can leave the Startup File empty.
  8. Apply the changes and create.
  9. After the resource is created, open it and go to Container Settings to turn on the Continuous Deployment. This is where the magic happens (not really magic)

Step 4: Adding environment variables

This is an optional step if you have the environment variables you haven’t included with the project.

This step is necessary when you have different environments like DEV and PROD and you don’t want to keep sensitive information in your GitHub because you don’t want all developers knowing your credentials to various APIs, secret keys and other tool credentials.

You can enter the environment variables used by your Express app directly into Application Settings in Azure. It will be accessible to your Node application. For example, if you want to run the app differently according to NODE_ENV variable like:

if (process.env.NODE_ENV == ‘production’) {// Do something when NODE_ENV is for productionelse {// Do something if it is not.// If you provided other environment keys through Azure, you can      access it in Express code like process.env.DATABASE_PASSWORD// It is if you provided DATABASE_PASSWORD in Azure’s Application Settings the same way as NODE_ENV}

For adding the environment variables in Azure, go to Application Settings and add the variables there like below:

Load testing with Azure Pipelines


Introduction

Performance issues can quickly turn expensive. Reasons can vary from unexpected traffic surges, pieces of non-performant code acting as bottlenecks, or misconfigured network components. Integrating load- and performance testing into your CI pipeline will allow you to know about performance degradations early, in most cases, even before it has any impact on your users in the production environment.

In this guide, we will be using k6 and Azure Pipelines to quickly, and effortlessly, get started.

k6 is a free and open-source testing tool for load and performance testing of APIs, microservices, and websites. It provides users with an easy-to-use javascript interface for writing load- and performance tests as code, effectively allowing developers to fit it into their everyday workflow and toolchain without the hassle of point-and-click GUIs.

Azure Pipelines is a continuous integration (CI) and continuous delivery (CD) service part of Microsoft's Azure DevOps offering. It can be used to continuously test and build your source code, as well as deploying it to any target you specify. Just as k6, it is configured through code and markup.

Writing your first performance test

It is usually a good idea to resist the urge to design for the end-goal right away. Instead, start small by picking an isolated but high-value part of the system under test, and once you got the hang of it - iterate and expand. Our test will consist of three parts:

  1. An HTTP request against the endpoint we want to test.
  2. A couple of load stages that will control the duration and amount of virtual users.
  3. A performance goal, or service level objective, expressed as a threshold.

Creating the test script

During execution, each virtual user will loop over whatever function we export as our default as many times as possible until the duration is up. This won't be an issue right now, as we've yet to configure our load, but to avoid flooding the system under test later, we'll add a sleep to make it wait for a second before continuing.

import http from 'k6/http';
import { sleep } from 'k6';
export default function () {
const res = http.get('https://test.k6.io');
sleep(1);
}

Configuring the load

In this guide, we will create a k6 test that will simulate a progressive ramp-up from 0 to 15 virtual users (VUs) for duration of ten seconds. Then the 15 virtual users will remain at 15 VUs 20 seconds, and finally, it will ramp down over a duration of 10 seconds to 0 virtual users.

import http from 'k6/http';
import { sleep } from 'k6';
export const options = {
stages: [
{ duration: '10s', target: 15 },
{ duration: '20s', target: 15 },
{ duration: '10s', target: 0 },
],
};
export default function () {
const res = http.get('https://test.k6.io');
sleep(1);
}

With that, our test should now average somewhere around ten requests per second. As the endpoint we're testing is using SSL, each request will also be preceded by an options request, making the total average displayed by k6 around 20 per second.

Expressing our performance goal

A core prerequisite to excel in performance testing is to define clear, measurable, service level objectives (SLOs) to compare against. SLOs are a vital aspect of ensuring the reliability of your system under test.

As these SLOs often, either individually or as a group, make up a service level agreement with your customer, it's critical to make sure you fulfill the agreement or risk having to pay expensive penalties.

Thresholds allow you to define clear criteria of what is considered a test success or failure. Let’s add a threshold to our options object:

import http from 'k6/http';
import { sleep } from 'k6';
export const options = {
stages: [
{ duration: '10s', target: 15 },
{ duration: '20s', target: 15 },
{ duration: '10s', target: 0 },
],
thresholds: {
http_req_duration: ['p(95)<250'],
},
};
export default function () {
const res = http.get('https://test.k6.io');
sleep(1);
}

In this case, the 95th percentile response time must be below 250 ms. If the response time is higher, the test will fail. Failing a threshold will lead to a non-zero exit code, which in turn will let our CI tool know that the step has failed and that the build requires further attention.

ℹ️ Threshold flexibility

Thresholds are extremely versatile, and you can set them to evaluate just about any numeric aggregation of the response time returned. The most common are maximum or 95th/99th percentile metrics. For additional details, check out our documentation on Thresholds.

Before proceeding, let's add the script file to git and commit the changes to your repository. If you have k6 installed on your local machine, you could run your test locally in your terminal using the command: k6 run loadtest.js.

Running your test in Azure Pipelines

To be able to use the marketplace extension in our pipeline, we first need to install it in our Azure DevOps organization. This can be done directly from the marketplace listing. Once that is done, we're all set for creating our pipelines configuration.

⚠️ Permission to install marketplace extensions required

The recommended approach is to use the marketplace extension, but if you for some reason can't, for instance if you lack the ability to install extensions, using the docker image as described further down, works great as well.

Local Execution

# azure-pipelines.yml
pool:
vmImage: 'ubuntu-latest'
steps:
- task: k6-load-test@0
inputs:
filename: 'YOUR_K6_TEST_SCRIPT.js'

We will run our tests on a virtual machine running the latest available version of Ubuntu. To run our actual load test, only one step is required.

The task for this step will be running the just installed k6-load-test extension. Additionally, we're supplying it with the filename of our test script. This will be the equivalent of executing k6 run YOUR_K6_TEST_SCRIPT.js on the pipeline virtual machine.

If your test is named test.js and is placed in the project root, the inputs key may be skipped altogether.

Do not forget to add azure-pipelines.yml and commit the changes to your repository. After pushing your code, head over to the Azure dashboard and visit the job that triggered the git push. Below is the succeeded job:

succeeded job

Cloud Execution

Cloud execution can be useful in these common cases:

  • You want to run a test from one or multiple geographic locations (load zones).
  • You want to run a test with a high-load that will need more compute resources than provisioned by the CI server.
  • Get automatic analysis of the results.

Running your tests in our cloud is transparent for the user, as no changes are needed in your scripts. Just add cloud: true to your pipeline configuration.

To make this script work, you need to get your account token from the cloud app and add it as a variable. The Azure Pipeline command will pass your account token to the Docker instance as the K6_CLOUD_TOKEN environment variable, and k6 will read it to authenticate you to the k6 Cloud automatically.

create variable

By default, the cloud service will run the test from N. Virginia (Ashburn). But, we will add some extra code to our previous script to select another load zone:

export const options = {
// ...
ext: {
loadimpact: {
name: 'test.k6.io',
distribution: {
loadZoneLabel1: {
loadZone: 'amazon:ie:dublin',
percent: 100,
},
},
},
},
};

This will create 100% of the virtual users in Ireland. If you want to know more about the different Load Zones options, read more here.

Now, we recommend you to test how to trigger a cloud test from your machine. Execute the following command in the terminal:

$ k6 login cloud
$ k6 cloud loadtest.js

With that done, we can now go ahead and git addgit commit and git push the changes we have made in the code and initiate the CI job.

By default, the Azure Pipelines task will print the URL to the test result in the k6 Cloud, which you may use to navigate directly to the results view and perform any manual analysis needed.

cloud url

cloud result

We recommend that you define your performance thresholds in the k6 tests in a previous step. If you have configured your thresholds properly and your test passes, there should be nothing to worry about.

If the test fails, you will want to visit the test result on the cloud service to find its cause.

Variations

Scheduled runs (nightlies)

It is common to run some load tests during the night when users do not access the system under test. For example, to isolate larger tests from other types of testing or to periodically generate a performance report.

Below is the first example configuring a scheduled trigger that runs at midnight (UTC) of everyday, but only if the code has changed on master since the last run.

# azure-pipelines.yml
pool:
vmImage: 'ubuntu-latest'
steps:
- task: k6-load-test@0
inputs:
filename: 'YOUR_K6_TEST_SCRIPT.js'
schedules:
- cron: '0 0 * * *'
displayName: Daily midnight build
branches:
include:
- master

Using the official docker image

If you, for any reason, don't want to use the marketplace extension, you may almost as easily use the official docker image instead.

# azure-pipelines.yml
pool:
vmImage: 'ubuntu-18.04'
steps:
- script: |
docker pull loadimpact/k6
displayName: Pull k6 image
- script: |
docker run -i \
-e K6_CLOUD_TOKEN=$(K6_CLOUD_TOKEN) \
-v `pwd`:/src \
loadimpact/k6 \
cloud /src/loadtest.js \
displayName: Run k6 cloud

Additional resources

Summary

Integrating k6 in Azure Pipelines is done in a matter of minutes. By integrating performance testing into your CI/CD process, you'll be able to identify and correct performance regressions and keep fulfilling your SLO or SLA requirements.

If you are a Microsoft user looking for an alternative to their deprecated load testing service, we suggest that you look at our article presenting k6 as an alternative to Visual Studio Load Tests.