If you've been keeping track of The Array release posts you know that we prioritize shipping things fast and often. Just as important to us is being sure that we are not going to break things unnecessarily for our users as we add new features and speedups.
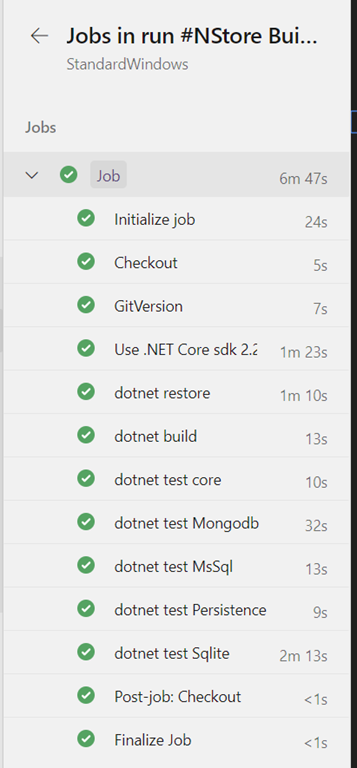
What we have found that works really well is nothing terribly novel by itself: a solid foundation of unit tests, end to end tests (integration tests), and CI/CD that for automation and gatekeeper keeping master clean.
In our Django codebase you'll find good number of Django tests that help keep us honest as we hack away at the backend of PostHog that keeps track of all the 1's and 0's that our customers depend on for making product decisions. These are our frontline defenders that let us know that something might be up before we even get to the point of creating a PR.
For this we do lean heavily on the standard Django test runner.
If you are interested in learning more on testing with Django check out Django's great docs on testing.
These tests only get you so far though. You know that the backend is going to behave well after you land the changes that you've made, but what if you accidentally changed something that breaks the frontend in weird and unexpected ways?
According to Cypress's GitHub repo it is a fast, easy and reliable testing for anything that runs in a browser. What does that mean exactly though?
It lets you programmatically interact with your application by querying the DOM and running actions against any selected elements. You can see that in a few of our Cypress test definitions
To keep our tested elements clear, manageable, and reusable upon refactor, we take advantage of the element attributes that html and react specifically recognize. Cypress has an amazing built in inspector on their test-runner that allows you to identify elements that you would like to add tests to.
While the tool works great, we found that occasionally the heavily nested components and classes would create selectors that were inflexible.
With the data-attr tag, we just need to keep track of the tag when updating/changing the components we're using without needing to rely on the inspector to find the precise selector for the test!
<LineGraphdata-attr="trend-line-graph"{...props}/>
describe('Funnels', () => {//boilerplate to make sure we are on the funnel page of the appbeforeEach(() => {cy.get('[data-attr=menu-item-funnels]').click()})// Test to make sure that the funnel page actually loadedit('Funnels loaded', () => {cy.get('h1').should('contain', 'Funnels')})// Test that when we select a funnel then we can edit that funnelit('Click on a funnel', () => {cy.get('[data-attr=funnel-link-0]').click()cy.get('[data-attr=funnel-editor]').should('exist')})// Test that we can create a new funnel when we click 'create funnel' buttonit('Go to new funnel screen', () => {cy.get('[data-attr=create-funnel]').click()cy.get('[data-attr=funnel-editor]').should('exist')})// Test that we can create a new funnel end to endit('Add 1 action to funnel', () => {cy.get('[data-attr=create-funnel]').click()cy.get('[data-attr=funnel-editor]').should('exist')cy.get('[data-attr=edit-funnel-input]').type('Test funnel')cy.get('[data-attr=add-action-event-button]').click()cy.get('[data-attr=trend-element-subject-0]').click()cy.contains('Pageviews').click()cy.get('[data-attr=save-funnel-button]').click()cy.get('[data-attr=funnel-viz]').should('exist')})})
I personally love this syntax. It feels super readable to me and reminds me a bit of the best parts of jQuery.
So that's all well and cool, but what about making sure that in a fit of intense focus and momentum we don't inadvertently push a breaking change to master? We need someone or something to act as a gatekeeper to keep us from from shooting ourselves in the foot. We need CI.
We could use Travis, or Jekins, or CircleCI… but as you may have noticed we keep almost everything about PostHog in GitHub, from our product roadmap, issues, this blog, everything is in GitHub. So it made sense to us to keep our CI in GitHub if we could. We decided to give GitHub Actions a test. So far, we have loved it.
GitHub actions are basically a workflow you can trigger from events that occure on your GitHub repo. We trigger ours on the creation of a pull request. We also require that our actions all return 👍 before you can merge your PR into master. Thus, we keep master clean.
To make sure that things are only improving with our modifications, we first re-run our Django unit and integration tests just to make sure that in our customers final environment things are still going to behave as expected. We need to be sure that there was nothing unique about your dev environment that could have fooled the tests into a false sense of awesome. You can check out how we set this up here Django github actions
The second round of poking we do with our app is we hit it with Cypress tests that we discussed earlier. These boot up our app and click through workflows just as a user would, asserting along the way that things look and behave as we would expect. You can check out how we've setup our Cypress action here
We ran up upon an issue though. Installing python dependencies, javascript dependencies, building our frontend app, booting up a chromium browser… this all takes a lot of time. We are impatient. We want instant gratifiction, at least when it comes to our code. Most of this stuff doesn't even change between commits on a PR anyways. Why are we spending valuable time and resources towards having things be repulled and rebuilt? That's where we ended up using one of the best features of GitHub Actions: the cache step.
Using the cache step we can cache the results of pulling python dependencies or javascript dependencies. This saves a chunk of time if you have ever messed around with watching yarn sort out the deps for a large frontend project. Check it out:
- uses: actions/cache@v1name: Cache pip dependenciesid: pip-cachewith:path: ~/.cache/pipkey: ${{ runner.os }}-pip-${{ hashFiles('**/requirements.txt') }}restore-keys: |${{ runner.os }}-pip-- name: Install python dependenciesrun: |python -m pip install --upgrade pippython -m pip install $(grep -ivE "psycopg2" requirements.txt) --no-cache-dir --compilepython -m pip install psycopg2-binary --no-cache-dir --compile
Note that there is no if block to determine whether to use the cache or not when we pip install the dependencies. This is because pip is smart enough to use the rehydrated cache if it sees it, if it doesnt see it it will just go out to the internet to grab what it needs.
Yarn is a bit more involved only because we grab the location of the cache directory first and use that output as an input to the caching step
- name: Get yarn cache directory pathid: yarn-dep-cache-dir-pathrun: echo "::set-output name=dir::$(yarn cache dir)"- uses: actions/cache@v1name: Setup Yarn dep cacheid: yarn-dep-cachewith:path: ${{ steps.yarn-dep-cache-dir-path.outputs.dir }}key: ${{ runner.os }}-yarn-dep-${{ hashFiles('**/yarn.lock') }}restore-keys: |${{ runner.os }}-yarn-dep-- name: Yarn install depsrun: |yarn install --frozen-lockfileif: steps.yarn-dep-cache.outputs.cache-hit != 'true'
That last line with the if block tells GitHub to not run yarn install if the cache exists. This saves us a ton of time if nothing has changed
On top of that, let's say you are making changes to only the API. There's no reason why you should be rebuiling the frontend each time the tests are run. So we go ahead and cache that between runs as well.
- uses: actions/cache@v1name: Setup Yarn build cacheid: yarn-build-cachewith:path: frontend/distkey: ${{ runner.os }}-yarn-build-${{ hashFiles('frontend/src/') }}restore-keys: |${{ runner.os }}-yarn-build-- name: Yarn buildrun: |yarn buildif: steps.yarn-build-cache.outputs.cache-hit != 'true'
Now you are catching if the cache exists so we can skip building the frontend altogether since it's been rehydrated from the last run. Nifty!
One of the best thing about Cypress is that you can grow with it. It would be a real pain if you invested all of this time into building out tests just to have your test suite take 60 minutes to run. Luckily both GitHub actions and Cypress have a solution to that!
matrix:# run 4 copies of the current job in parallelcontainers: [1, 2, 3, 4]
- name: Cypress runuses: cypress-io/github-action@v1with:config-file: cypress.jsonrecord: trueparallel: truegroup: 'PostHog Frontend'env:# pass the Dashboard record key as an environment variableCYPRESS_RECORD_KEY: ${{ secrets.CYPRESS_RECORD_KEY }}# Recommended: pass the GitHub token lets this action correctly# determine the unique run id necessary to re-run the checksGITHUB_TOKEN: ${{ secrets.GITHUB_TOKEN }}
Depending on the count of tests and the frequency you are running your suite this might cost you some money having to upgrade your account on Cypress.io but their free tier is pretty generous and they do have OSS plans that are free.
This all has cut the time it takes for GitHub to stamp our pull requests from >10 minutes to ~5 minutes and that's with our relatively small set of tests.
As we grow functionality within PostHog all of this will only become more important so that we don't end up with a 30 minute end to end test blocking you from landing that really killer new feature. Sweet.
The final bit here is what happens if the tests are failing?
If this is all happening in a browser up in the cloud how do we capture what went wrong? We need that to figure out how to fix it. Luckily, again, Cypress and GitHub actions has a solution: artifacts.
Artifacts allow us to take the screenshots that Cypress takes when things go wrong, zip them up, and make them available on the dashboard for the actions that are being run.
- name: Archive test screenshotsuses: actions/upload-artifact@v1with:name: screenshotspath: cypress/screenshotsif: ${{ failure() }}
As you can tell by the if block here, we only upload the artifacts if there is a problem. That's because we already know what the app will look like when things go right… hopefully 😜
There is one thing that we don't capture in our current test suite: Performance!
We have customers who upload hundreds of telemetry events a second. If we introduce a regression that dings performance this could cause an outage for them where they lose data which is arguably worse than a regression on the frontend.
Our plan here use GitHub actions to standup an instance of our infrastructure and hammer it with sythentic event telemetry and compare that against a baseline from prior performance tests. If the test runtime changes materially we will block the pull request from being merged in to guard master from having a potentially breaking change. Stay tuned for a post on automated performance testing.
Hey! You made it this far. If you see yourself working on challenging issues at a high paced startup with a really rad group of people. You are in luck! We are looking for people like you!


